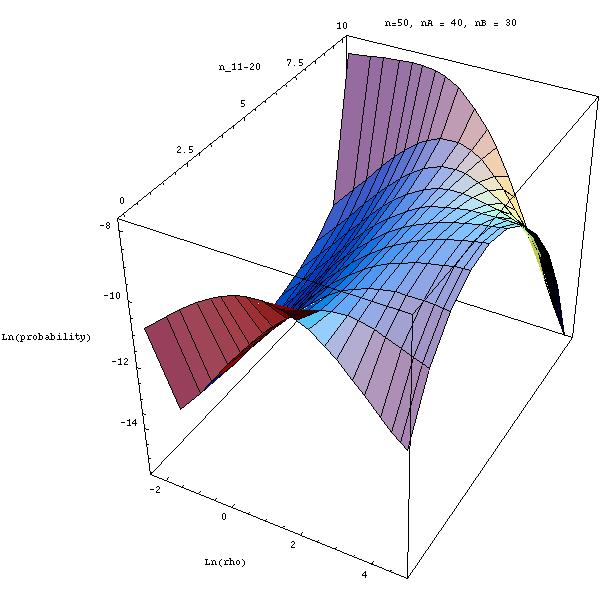
 This plot shows values of h(50;rho) as described in
Hudson(2001) (submitted to Genetics). The sample configurations
shown are where the marginal frequencies of the derived alleles are 40/50 and
30/50. The axis labeled n_11-20, indicates the sample configuration,
i.e., the configuration with 24 1-1 gametes (or A-B gametes) corresponds
to n_11-20 = 24 - 20 = 4 on that axis. (So only integer values are
meaningful on this axis. These sample probabilities are tabulated
in the file h50rho.zip which is located elsewhere
at this site
. ( If this file is downloaded and unzipped, the numbers used to
create the figure can be obtained by: grep -A 21 "freq: 40 30" h50rho . )
They can also be estimated with
the programs in the directory ehnrho .
This plot shows values of h(50;rho) as described in
Hudson(2001) (submitted to Genetics). The sample configurations
shown are where the marginal frequencies of the derived alleles are 40/50 and
30/50. The axis labeled n_11-20, indicates the sample configuration,
i.e., the configuration with 24 1-1 gametes (or A-B gametes) corresponds
to n_11-20 = 24 - 20 = 4 on that axis. (So only integer values are
meaningful on this axis. These sample probabilities are tabulated
in the file h50rho.zip which is located elsewhere
at this site
. ( If this file is downloaded and unzipped, the numbers used to
create the figure can be obtained by: grep -A 21 "freq: 40 30" h50rho . )
They can also be estimated with
the programs in the directory ehnrho .